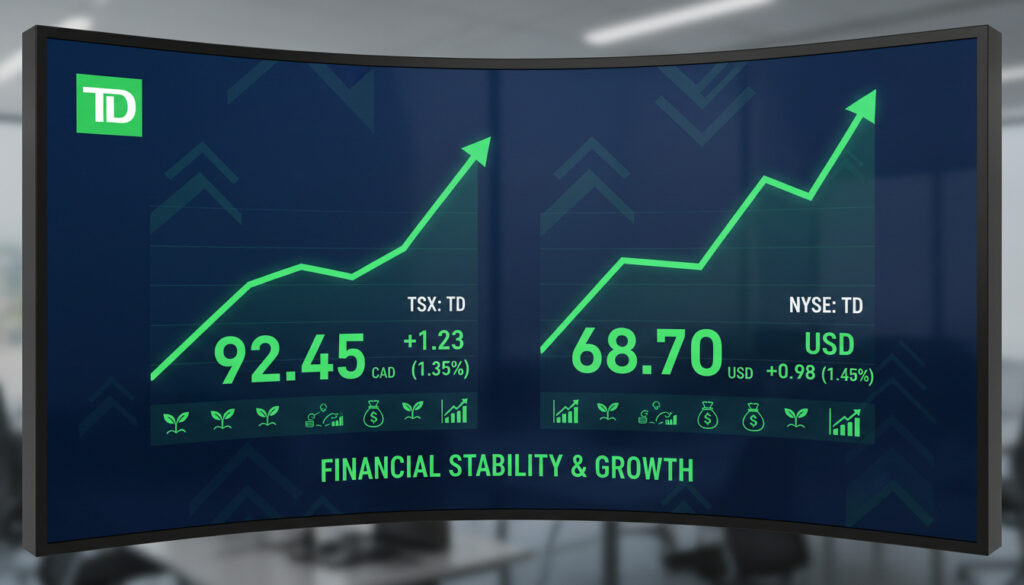
TD Bank Share Price – Live TSX NYSE Data Dividends
Toronto-Dominion Bank currently trades at 132.51 CAD on the Toronto Stock Exchange, representing a 0.91% increase over the past 24 hours. On the New York Stock Exchange, shares change hands at approximately $93.52 to $94.68 USD, reflecting the dual-listed nature of Canada’s second-largest bank by market capitalization.
With a market capitalization of roughly 195.07 billion CAD on the TSX and 157.99 billion USD on the NYSE, TD maintains substantial liquidity across North American markets. The stock attracts income-focused investors through its quarterly dividend distributions while drawing value attention from depressed price-to-earnings ratios compared to historical banking sector norms.
What is the Current TD Bank Share Price?
- Dual listing provides liquidity across Toronto and New York exchanges
- Recent session gained 0.91% on TSX despite weekly decline of 0.28%
- Trailing twelve-month dividend yield stands at 3.68% with quarterly distributions
- Price-to-earnings ratios vary between 9.78 and 11.39 depending on data provider methodology
- Last quarterly EPS of 2.20 CAD exceeded consensus estimates by 7.06%
- Beta coefficient of 0.20 indicates significantly lower volatility than broader markets
- Current share price exceeds maximum analyst price targets of 125.00 CAD
| Metric | Value | Context |
|---|---|---|
| TSX Price | 132.51 CAD | +0.91% (24h) |
| NYSE Price | $93.52 USD | Near 52-week high |
| Market Cap (CAD) | 195.07 Billion | Down 0.28% weekly |
| Market Cap (USD) | 157.99 Billion | NYSE equivalent |
| P/E Ratio (TTM) | 9.78 – 11.39 | Source dependent |
| Dividend Yield | 3.68% | Quarterly payments |
| EPS (Basic TTM) | 11.69 CAD | Trailing twelve months |
| Beta (Volatility) | 0.20 | Low volatility metric |
| 52-Week High | $96.44 | NYSE (per Robinhood) |
| 52-Week Low | $54.14 | NYSE (per Robinhood) |
| Avg Volume (3M) | 3.02 Million | NYSE |
| Next Earnings | December 4, 2025 | Confirmed date |
TD Bank Stock Performance and Historical Chart
52-Week Trading Range
NYSE-listed TD shares have fluctuated between $54.14 and $96.44 over the past 52 weeks, according to Robinhood data. The current trading level of approximately $93.52 sits near the upper bound of this historical channel, recovering significantly from the 2024 lows but remaining below the peak established earlier in the cycle.
Volatility Characteristics
The stock exhibits remarkably low volatility with a beta coefficient of 0.20, as reported by TradingView. This suggests TD moves about one-fifth as dramatically as the broader equity market, positioning it as a defensive holding during turbulent periods.
Volume Metrics
Recent NYSE sessions saw volume of 1.67 million shares traded, falling below the three-month average of 3.02 million. This reduced activity may indicate a consolidation phase or institutional holding patterns ahead of the December earnings report.
TD’s official investor relations portal provides comprehensive historical charts comparing TSX and NYSE performance against peer institutions and major indices. For price data predating 1973, the Toronto Stock Exchange maintains archival records available through their official channels.
TD Bank Dividend Yield and Payout Details
Current Dividend Metrics
The bank currently distributes dividends quarterly, with the most recent payment totaling 1.05 CAD per share. The trailing twelve-month yield stands at 3.68%, though this represents a decline from the 5.30% yield observed during 2024, according to TradingView. Investors seeking alternative asset performance metrics can reference Gold Price in India – Live 24K and 22K Rates Today for commodity market comparisons.
Payout Sustainability
The 2024 payout ratio reached 86.29%, indicating the bank distributed the majority of earnings to shareholders. While this appeals to income-focused portfolios, such elevated payout levels may limit flexibility for capital retention or expansion initiatives should earnings face pressure.
The 2024 payout ratio of 86.29% indicates TD distributed nearly 87 cents of every earnings dollar to shareholders. While supporting current yield, ratios exceeding 80% may signal limited room for dividend growth or vulnerability during earnings compression.
TD Bank Stock Forecast and Analyst Outlook
Analyst Price Targets
Consensus estimates place maximum price targets at 125.00 CAD with minimum projections of 100.00 CAD, according to TradingView analyst data. Both figures imply potential downside from current trading levels near 132.51 CAD. For sports investors tracking Toronto market trends, see Toronto Raptors vs Sacramento Kings Match Player Stats – Box Score & Key Stats.
Valuation Assessment
Investing.com models suggest fair value calculations indicate a -2.3% upside potential, while analyst consensus points to -1.8% returns. These projections contrast with typical banking sector expectations, warranting careful examination of underlying assumptions regarding revenue sustainability.
Analyst targets currently sit below the live trading price, suggesting caution among market observers. Revenue estimates for the upcoming quarter project 13.82 billion CAD, though these figures remain speculative until formal guidance is released following the December 4 earnings date.
Key Dates and Market Events
- Last Quarterly Report: TD exceeded earnings estimates of 2.05 CAD per share, reporting actual EPS of 2.20 CAD. Revenue totaled 14.05 billion CAD, beating projections of 13.74 billion. Source: TradingView
- Next Earnings Date: December 4, 2025, marks the scheduled release of upcoming quarterly results. Source: TradingView
- 2024 Dividend Yield: During 2024, the stock maintained a higher yield of 5.30%, reflecting different price levels and payout ratios compared to current metrics. Source: TradingView
- Annual Net Income: Full-year net income reached 8.84 billion CAD, with last quarter net income of 3.34 billion CAD representing a 70% quarterly decline from prior periods. Source: Exchange filings via Investing.com
- Revenue Reporting: Last quarter revenue of 14.05 billion CAD beat estimates, though next quarter projections suggest moderation to 13.82 billion CAD. Source: Yahoo Finance
What Data is Confirmed versus Estimated?
| Verified Exchange Data | Analyst Projections & Estimates |
|---|---|
| TSX price: 132.51 CAD (live) | Price target max: 125.00 CAD |
| NYSE price: ~$93.52 USD | Price target min: 100.00 CAD |
| Market cap: 195.07 B CAD | Fair value upside: -2.3% |
| Last EPS: 2.20 CAD (actual) | Next EPS estimate: 2.01 CAD |
| Next earnings: Dec 4, 2025 (confirmed) | Revenue estimate: 13.82 B CAD |
| Dividend: 1.05 CAD quarterly (paid) | Yield projections: Variable |
Market Position and Banking Operations
Toronto-Dominion Bank operates as a major North American financial institution, with headquarters in Toronto and leadership under Chief Executive Officer Raymond Chong Ho Chun. While official documentation cites 1955 as the founding date, some historical records trace lineage to 1855 through predecessor institutions. The bank structures operations across four primary segments: Canadian Personal and Commercial Banking, U.S. Retail, Wealth Management and Insurance, and Wholesale Banking.
This diversification spans both Canadian domestic markets and significant American retail presence, differentiating TD from purely domestic competitors. The International Securities Identification Number (ISIN) CA8911605092 facilitates cross-border trading, enabling the dual-listing structure that provides investors access through either Toronto or New York exchanges depending on currency and regulatory preferences.
Regulatory filings available through SEC EDGAR and TD Investor Relations provide additional transparency regarding segment performance and geographic revenue distribution.
Data Verification and Exchange Attribution
Last quarter revenue reached 14.05 billion CAD, beating estimates of 13.74 billion, while net income of 3.34 billion CAD declined 70% from the prior quarter.
— TradingView Market Data
TD shares traded on NYSE within a 52-week range of $54.14 to $96.44, with current pricing near the upper bound at approximately $93.52.
— Robinhood Stock Profile
Analyst consensus indicates potential downside risk with price objectives ranging 100.00-125.00 CAD, below current market levels.
TD Share Price Overview
TD Bank currently trades at 132.51 CAD on the TSX and approximately $93.52 USD on the NYSE, carrying a market capitalization near 195 billion CAD. While the stock offers a 3.68% dividend yield with low volatility characteristics, analyst targets suggest potential downside risk with price objectives ranging 100.00-125.00 CAD. The confirmed earnings date of December 4, 2025, provides the next concrete catalyst for price discovery.
Frequently Asked Questions
When is TD Bank’s next earnings date?
TD Bank has confirmed December 4, 2025, as the date for its next quarterly earnings release.
What is TD Bank’s current dividend yield?
The trailing twelve-month dividend yield stands at 3.68%, with quarterly payments of 1.05 CAD per share.
What are TD Bank’s 52-week high and low prices?
On the NYSE, TD has traded between $54.14 and $96.44 over the past 52 weeks.
Is TD Bank stock considered a buy right now?
Analyst consensus remains cautious, with price targets of 100.00-125.00 CAD suggesting potential downside from current levels near 132.51 CAD.
Why does TD trade at different prices on TSX and NYSE?
The price differential reflects current USD/CAD exchange rates, with TSX pricing in Canadian dollars and NYSE pricing in U.S. dollars.
How volatile is TD Bank stock?
TD maintains a beta of 0.20, indicating approximately 80% less volatility than the broader stock market.
More related posts
 Capital of British Columbia: Why Victoria, Not Vancouver
 Reggie Miller: Career, Rings, Family, and Jordan Rivalry
 Belle Delphine 2026: What Happened and Where Is She Now
 Kelly Osbourne: MS myth, sister feud, and Ozzy’s inheritance
 Whoop-Up Days 2025: Dates, Parade, Fireworks & History
 George of the Jungle – Iconic 1967 Cartoon Parody
 What Do Polar Bears Eat – Seals, Hunting Facts & Myths
 Ham and Cheese Sliders: Easy Recipe on Hawaiian Rolls
